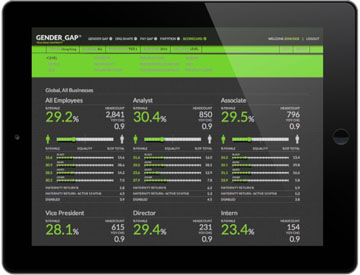
Gender Gap delivers smart and easy-to-translate visual representation of your HCM data to your desktop or tablet.
Most organizations struggle with effectively measuring the effect of diversity on the bottom line. In some cases, the challenge is determining what measures will yield useful data. In others, it is more about the transformation of so many disparate bits of data into clear and actionable insight.
Data drives decisions. And so often, our efforts in diversity and inclusion stall because of our inability to tie efforts to business outcomes.
Which is exactly what Sam Jones, CEO and founder of Data Morphosis™, set out to change with a product called Gender Gap™—a sophisticated data visualization software that offers on-demand measurement, reporting, and modeling of an organization’s human capital data. It overlays this human capital data with business performance data, providing a new, consolidated view of the value of your workforce.
The result? Gender Gap puts diversity squarely at the center of an organization’s talent strategy by showing the correlation between business performance and diverse, inclusive teams.
“I met so many diversity heads who were fatigued, and had lost ability to drive real change in a business,” says Jones.
“Every business maintained that people were their most important asset. If people were truly at the heart of your business, why weren’t HR and D&I given world-class tools to do their job even better and more efficiently?
“I decided to turn my frustration into inspiration—and Gender Gap was born.”
The software allows users to consolidate human capital management (HCM) data from one or many sources and transform it to visual insight. Gender Gap is a new lens for organizations, enabling them to explore every strand of diversity and talent grouping across all business units, in every location. It provides HR and diversity heads with rapid, real-time access to critical data that allows them to measure diversity in their organization against business performance
metrics and bring diversity into the boardroom in a powerful, visual way.
“We designed the software to be as visual as possible, so there could be no doubt to the audience how critical diversity was to success,” says Jones.
“We hired the smartest engineers we could find—with backgrounds in video gaming, and from organizations like NASA—and gave them the task of converting messy human capital data into visual insights regarding the commercial connection between diverse and inclusive teams, and dollars
and cents.”
What they developed was an innovative, user-friendly interface that many of the world’s largest companies now employ to transform the way they interact with human capital data. For Jones, this is more than a successful software product.
“I’m confident,” he says, “that this is the weapon that can end the fatigue!”